Virtonomics Entrepreneurship Project
Virtonomics is an online business simulator based on real world economic, business, entrepreneurship and management principles. The virtual economy is fully populated by real-life players creating a strikingly realistic representation of a real-world global economy with financial operations, free-markets, trade, retail, production and partnerships. The game is highly stimulating as there is no linear pattern, no algorithms for winning or losing. Each player can make endless determinations as they pursue their unique business goals. Each student can customize their business aims, strategy and tactics which can evolve to reflect the principles they learn in class. The interface allows students to experiment, learn and fail in the business world with out the risk of financial loss and ruin.
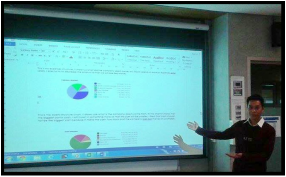
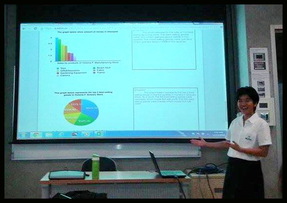
After initial trial periods for students to build their business vocabulary and learn about the game interface, the class began a 52-day business simulation, where each real-life day counted as one business week in the game world. The 52-day game year was divided into four business quarters, during which time students would summarize their progress in a Quarterly Report to their investors. Each student was given a set number of stocks which together with the equity calculated from their Balance Sheet was used to calculate a stock price. Students kept track of their virtual data including stock value and gave in-class presentations to simulate the presentation to stock holders at a Quarterly Shareholders Meeting. For the final Annual Report, students also submitted a Balance Sheet and Income Statement, as well as a video message to their shareholders.
After initial trial periods for students to build their business vocabulary and learn about the game interface, the class began a 52-day business simulation, where each real-life day counted as one business week in the game world. The 52-day game year was divided into four business quarters, during which time students would summarize their progress in a Quarterly Report to their investors. Each student was given a set number of stocks which together with the equity calculated from their Balance Sheet was used to calculate a stock price. Students kept track of their virtual data including stock value and gave in-class presentations to simulate the presentation to stock holders at a Quarterly Shareholders Meeting. For the final Annual Report, students also submitted a Balance Sheet and Income Statement, as well as a video message to their shareholders.
We feel that this project is an embodiment of the philosophy of this elective - to allow students to increase their vocabulary in the field of economics while providing opportunities for real-life applications of course content. As many of the students in the class have expressed interest in pursuing careers in business, we continue to look for ways to offer them both content and challenges that will help them develop the skills necessary to pursue their future goals.
Additional Quarterly Reports and other supplemental files compiled by students are available below:
Additional Quarterly Reports and other supplemental files compiled by students are available below:
